I'm a Data Analyst
Raw data turned into clear reports, with the numbers checked before they're shown.
I'm a second-year BA Economics (Hons) student at Maharshi Dayanand University, Rohtak (2025–2029) with a minor in Mathematics, building a career in data analysis. My core tools are Power BI, MySQL and Excel, and I'm learning Python (pandas).
From July to September 2026 I worked as a Data Operations Trainee at the Municipal Corporation of Gurugram: keeping records for 95 solid-waste vehicles, cleaning GPS data in Excel and sending daily reports to senior officials. Alongside that I've built four end-to-end analytics projects, listed below.
One habit I care about: checking my numbers before I present them. When I re-audited my own logistics dashboard against the raw data, three data-entry errors had changed my main conclusion. The Data Audit section shows what I found.
I'm looking for data analyst, MIS or reporting roles and internships, and I take on small freelance dashboard projects.
Municipal Corporation of Gurugram · Full-time, on-site
Self-initiated portfolio projects, each from raw data to dashboard.
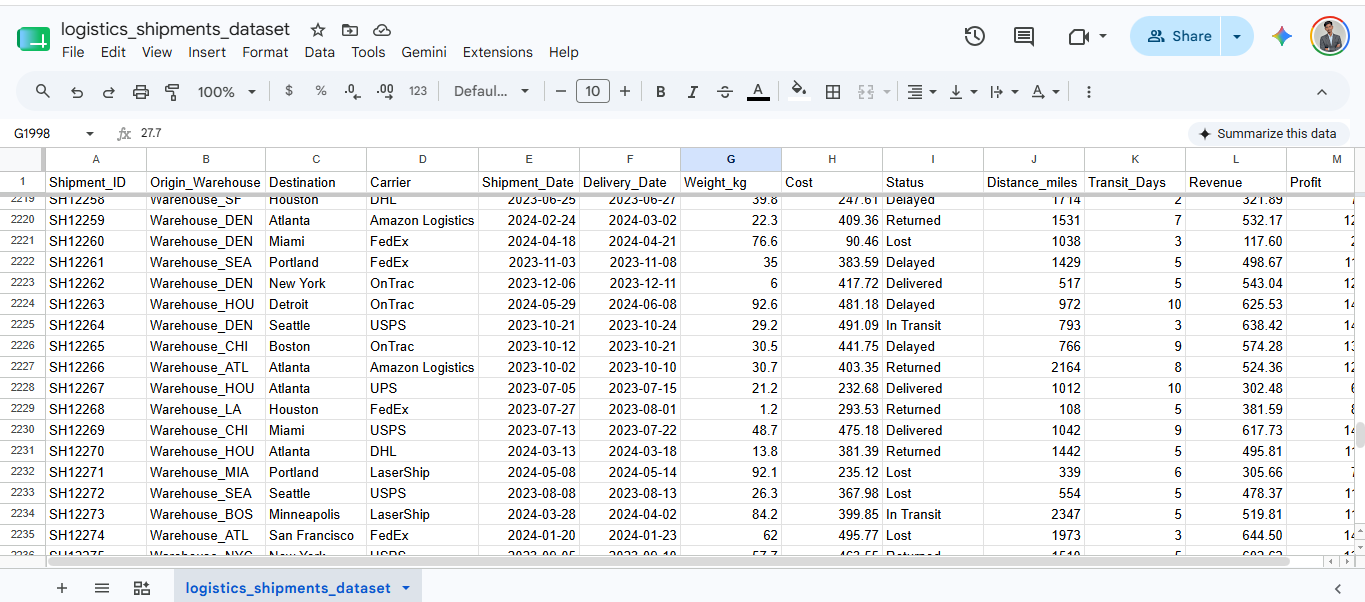
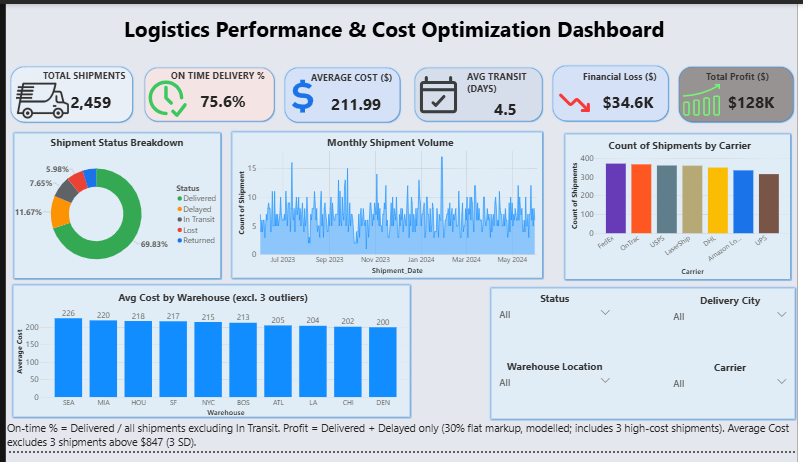
A Google Sheets → Power BI reporting flow for 2,459 shipments, 7 carriers and 10 warehouses (Jun 2023 – May 2024), with an Apps Script trigger that emails a daily "data entry complete" alert.
Practice dataset · profit is modelled at a flat 30% markup
The screenshot above predates my data audit. Corrected figures are in the Data Audit section.
View Project →
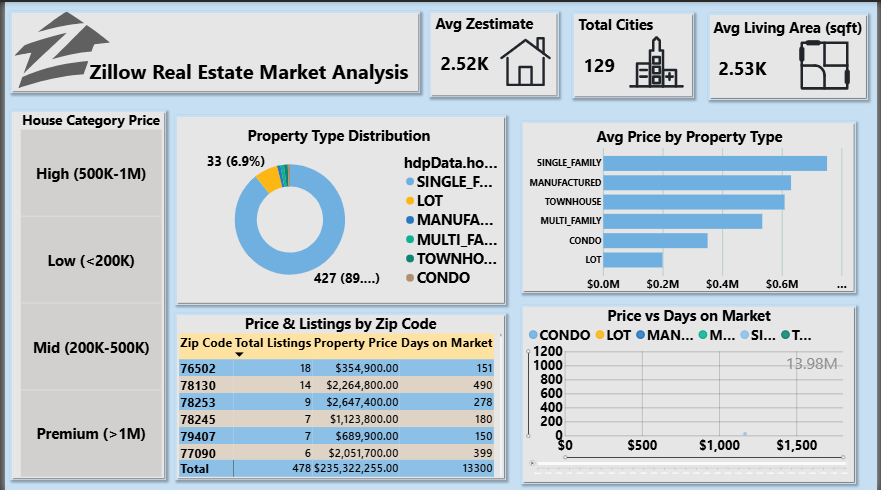
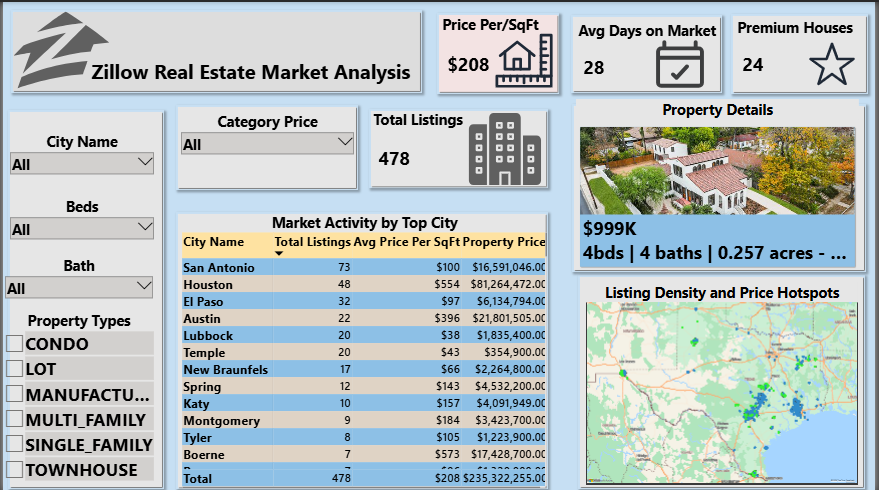
No ready-made CSV: I extracted 478 property listings from a real estate site's JSON network responses (browser Network tab), cleaned them with VS Code and Power Query, then built an interactive dashboard with city, beds, baths and property-type slicers, price-category analysis, custom DAX measures and an Azure Maps listing-density map.
478 listings · JSON extraction · custom DAX measures
View Project →
100,000 sample card transactions loaded into MySQL, analysed with 4 SQL KPI queries (total fraud loss, top cities, fraud by transaction type, peak hours) and presented in a Power BI dashboard.
100,000 sample transactions · 4 SQL KPI queries · MySQL → Power BI
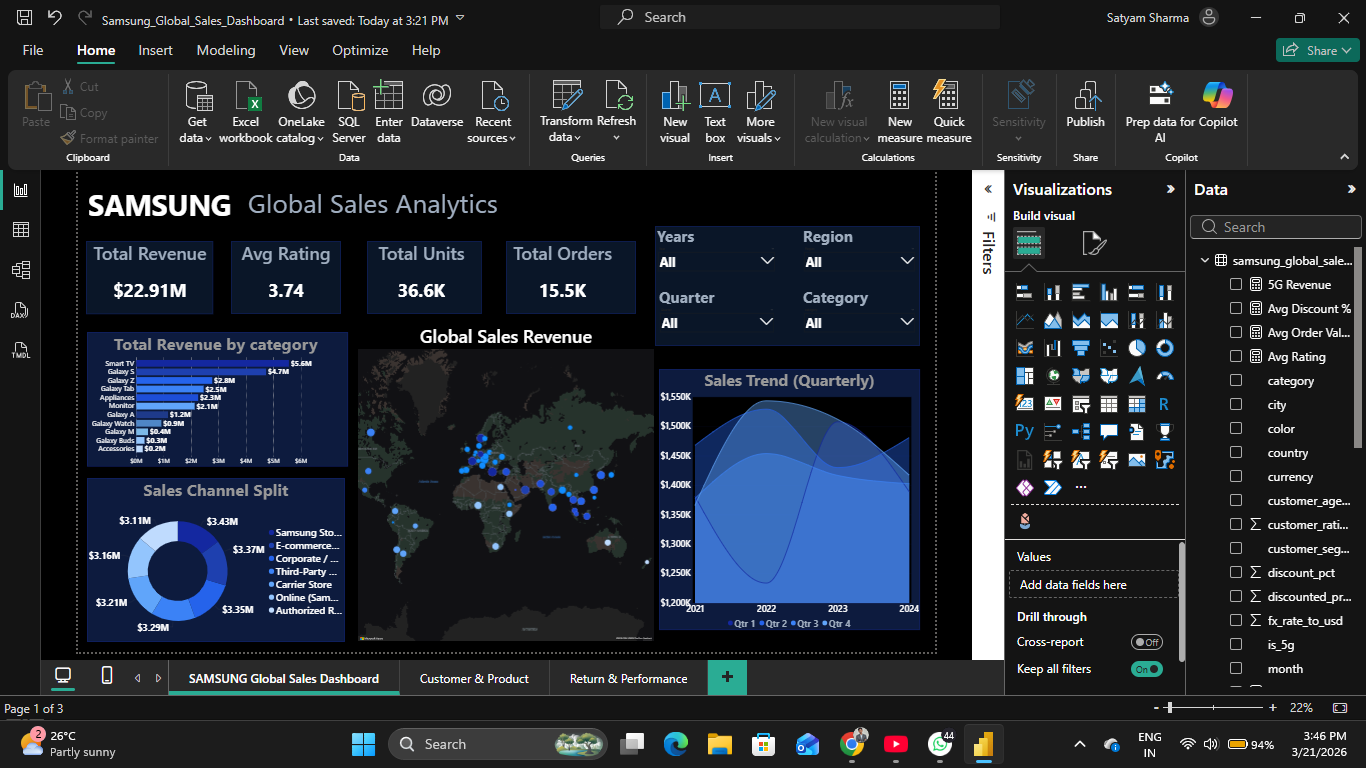
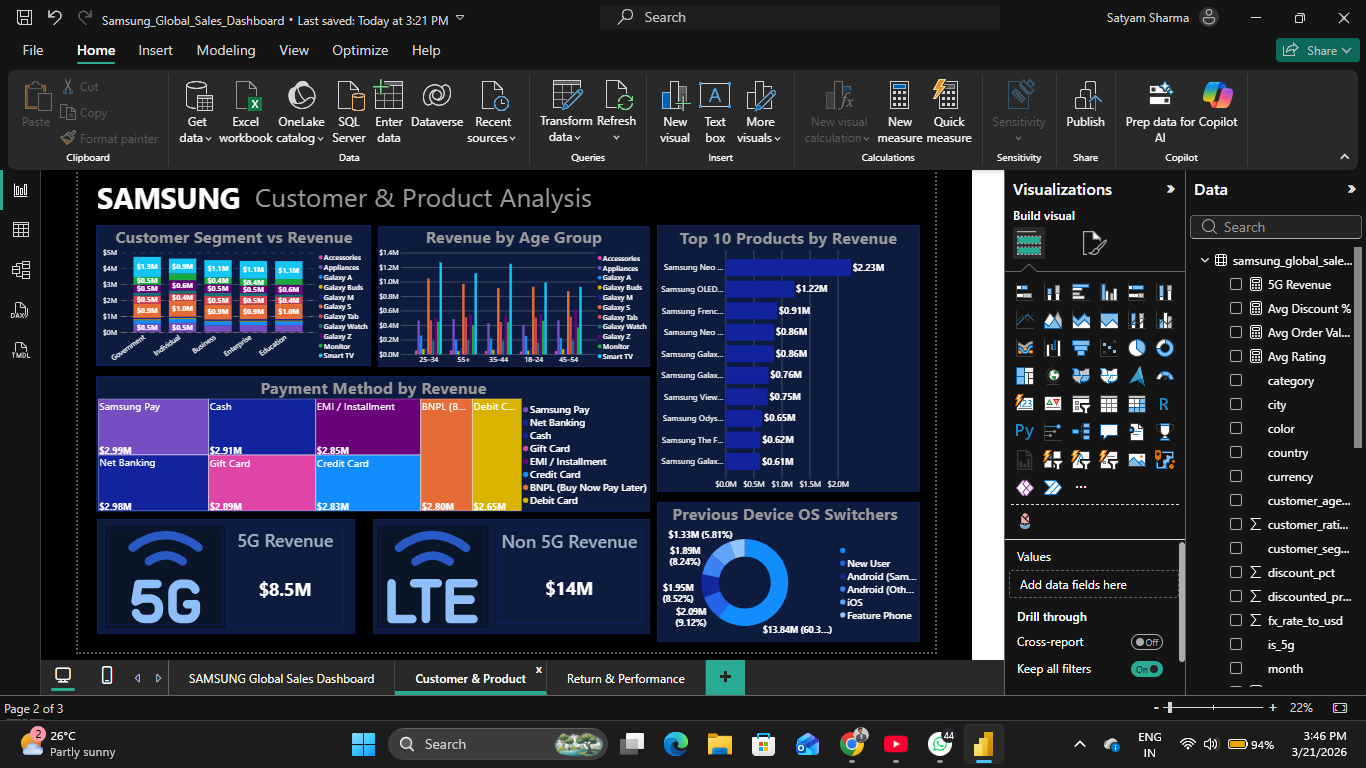
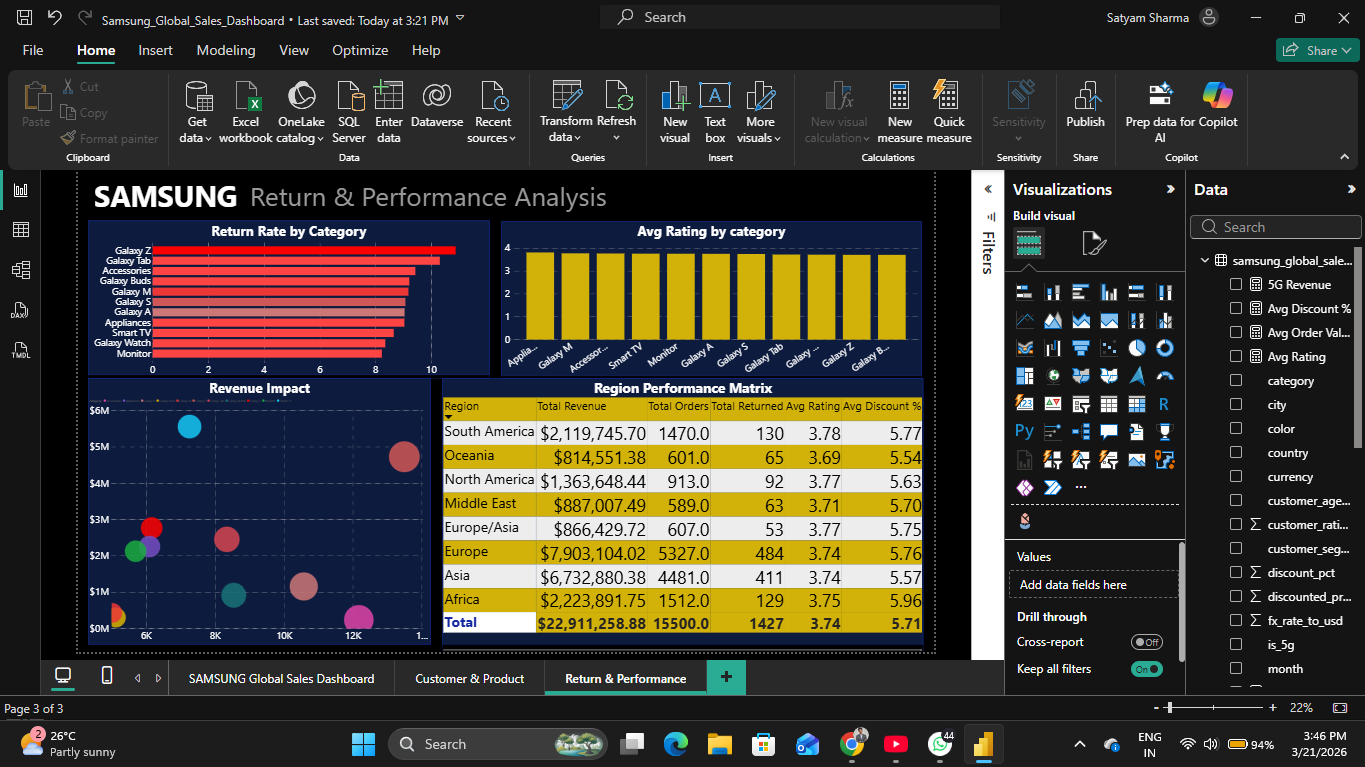
A MySQL database (schema, import, indexes) of 15,500 transactions across 52 countries, with 7 analytical query blocks on category, region, channel, returns and year-over-year growth, and a 3-page Power BI dashboard (Executive Overview, Customer + Product, Return + Performance).
15,500 transactions · 28 columns · 52 countries · 7 query blocks
Before publishing this portfolio I re-computed every headline number in my Logistics dashboard from the raw 2,459-row dataset (with AI assistance) and compared it with what the dashboard showed. Three data-entry errors had changed my main conclusion.
| Metric | My dashboard said | The raw data says |
|---|---|---|
| Total shipments | “2K” (card rounding) | 2,459 shipments. |
| Most expensive carrier | UPS, $235 per shipment | UPS is $212 once 3 extreme-cost rows are excluded ($6,562, $6,229 and $1,598; the next-highest shipment in the dataset costs $783). FedEx ($228) and DHL ($225) cost more. |
| Costliest warehouses | Houston ($242) and Los Angeles ($233) | The same 3 rows inflated both. Cleaned, Seattle ($226) is highest; Houston is $218 and LA is $204. |
| “Shift UPS volume to USPS to cut cost 10–15%” | Cheaper carrier, so move volume | USPS saves $7.85 per shipment (3.7%) but loses 8.3% of shipments vs 3.8% for UPS. Counting a lost shipment's cost as lost, the extra expected loss (about $8.85 per shipment) cancels the saving. Moving all UPS volume would change total cost by about 0.5%. |
| Total profit | $161K | $128K on delivered and delayed shipments. $32K had been counted on lost, returned and in-transit shipments. In this dataset profit is a flat 30% markup on cost, so it is modelled, not observed. |
| On-time delivery | 70% | 75.6% once In Transit shipments are excluded. The 70% treated shipments that aren't late yet as late. |
| Boston and SF “10% slower” | About 10% slower than Denver and NYC | True on raw averages (4.77 and 4.64 vs 4.29 and 4.30 days), but per 1,000 miles the gap is only about 3%. These warehouses ship longer routes. |
4 Revenue and 2 Profit values were stored as text with thousands separators (e.g. “8,097.86”), there was no outlier check, and I hadn't written down what each KPI includes.
Re-compute headline KPIs from the raw data, look for outliers and text-typed numbers, and state what a metric includes (like profit on lost shipments) before turning it into a recommendation.
Power BI: Power Query, DAX (basic), slicers, bookmarks, Azure Maps. Excel: Pivot Tables, SUMIF, COUNT, VLOOKUP, XLOOKUP, Remove Duplicates, MIS-style daily reports.
MySQL: SELECT, WHERE, GROUP BY, aggregate functions, data import and cleaning. HackerRank SQL (Intermediate) certified.
pandas basics for cleaning and checking data. Currently learning, and using it to audit my own projects.
Data cleaning, KPI dashboards, JSON extraction (browser Network tab, Power Query), Google Sheets, Apps Script time-driven triggers.
MySQL Workbench, Power BI Desktop, VS Code, GitHub. I use Claude and Gemini to speed up SQL, DAX and Excel formulas, and I check their output.
Daily MIS reports delivered on time to senior officials, and data explained in meetings with government officials. Accurate entry, clear written updates and working with a team.
Internships · entry-level analyst & MIS roles · small freelance dashboard projects
Or reach me directly: satyamsharmallc@gmail.com